
A website is one of the most important marketing and sales assets for a middle-market company. But its effectiveness as a tool for growing your business is tied to the quality of data you gather and how you use it to drive growth. While website metrics are crucial, not all web analytics metrics are equally helpful. The metrics to track should offer relevant data and help you interpret and implement changes based on those findings. This article covers the important website metrics your company should be analyzing. And how looking at Google Analytics metrics or data in other popular programs can be used to maximize your marketing efforts. We examine 10 specific metrics you should be tracking, why they’re important, and the benchmarks you should be judging your results again. By the end of this blog, you will better understand how to look at your site’s analytics, what’s important, how to gauge success, and improve your site’s key performance indicators (KPIs).
Website Metrics to Track and Prioritize
Website metrics have no uniform priority, the priorities of a website’s performance are likely to change based on specific business goals, industries, products, or services. The list below is arranged alphabetically for easy reference. Let’s begin with the metric for ‘average time on page.’ Metric #1: Average Time on Page Average time on page measures how long a user spends on a specific webpage. It’s an important website metric that reflects user engagement and content relevance. A decent benchmark is 50-60 seconds, but this will vary widely by your website’s structure, content, and user expectations. Comparing your current values against earlier periods of website performance will help gauge content effectiveness over time. How to Increase the Average Time on Page Metric The easiest way to boost user time on page is to create longer, highly engaging content on your website. Use visuals and captivating headings, and include page navigation shortcuts for longer pieces of content. Lastly, ensure your website content offers visitors valuable insights that match their expectations.
Creating blogs, image galleries, and embedding YouTube videos are easy ways to help improve your website’s time on page metric. And the longer visitors stay on your website the more likely they are to move down your marketing and sales funnel.
Metric #2: Bounce Rate
This metric measures the percentage of site visitors who leave after viewing only one page. A rate between 25% and 70% is a good place to start. A low rate suggests good engagement, relevance, and good user experience for links and navigation through your website’s pages. Comparing past bounce rates will help you identify certain trends and fix any problems.
How to Reduce the Bounce Rate Metric
Several factors can influence bounce rates. Typical causes include technical issues like slow page load speeds, poor quality content or page content irrelevant to a user’s search query, bad call-to-action placement, and confusing navigation. Fix any issues, then tailor content to user intent while providing clear pathways to your other pages. These simple fixes will encourage visitors to stick around.
It’s also important to recognize that a high or low rate isn’t inherently good or bad. For example, your contact page is likely to have a high bounce rate because the visitor has done what they came to do, contact you. Pathing visitors through 2-3 pages when one would do will reduce your bounce rate but provide a worse user experience.
Metric #3: Click-Through Rate (CTR)
CTR measures link or button clicks compared to views. A high CTR means effective content and CTAs. A 1-1.5% CTR is a reasonable benchmark for many websites, but check your historical data for detailed insights into website performance. Reviewing your current values against older ones offers insights into overall content and CTA performance.
How to Improve the CTR Metric
To improve this metric, check that your CTAs are relevant, clear, and aligned with user intent. Also, check for action-oriented language and the use of contrasting visuals like color, shape, size, and other design attributes. Finally, place your CTAs in prominent locations and conduct A/B (split) testing to improve strategies.
If your page’s CTA is struggling, consider doing some testing and change up the CTA wording or consider making a different appeal or offer to your page visitors to see if it works better.
Website Metric #4: Conversion Rate
Your conversion rate is the percentage of visitors who take a desired action, e.g., subscribing or purchasing. These key metrics measure how effectively your web pages turn visitors into leads or customers. Benchmarks vary from business to business, and the type of clientele they are sucking. But, aim for 2.35% as a starting benchmark. Reviewing current and past metrics helps gauge campaign effectiveness and changes in user behavior.
How to Increase Conversion Rates
Enhance conversion rates by optimizing landing pages, streamlining forms, and ensuring a clear value proposition. You can also add trust signals, such as customer reviews, and A/B testing to review strategies that resonate best with your audience and encourage action. Look for ways you can preemptively address why your prospect may say no and make it easy for them to say yes.
Revitalize Your Online Presence with a Website Design and Refresh
At Bold Entity, our professional website design and site refresh experts breathe new life into your brand’s digital identity. We create an SEO-optimized, captivating online representation for mid-market businesses to align perfectly with your company’s ethos and engage your audience.
Are you ready to elevate your B2B web presence?
Contact Bold Entity to Learn More
Website Metric #5: Exit Pages
Exit pages show where users frequently leave your site. Analyzing them helps you identify potential weak points in user experience, navigation, and website content. Lower exit rates on important pages suggest visitors who reach these pages are engaged to continue their journey across your website.
Ideally, your benchmark for exit pages should focus on natural exit points, such as confirmation and thank you pages (post transaction). In contrast, high exit rates for products or landing pages might indicate issues, be they technical or content in nature.Comparing this data helps identify trends and areas requiring improvement.
For example, a high exit page rate on a product page may point to it being misrepresented in search engine result pages, a broken link, or a need for a specific landing page to try and convert visitors while they’re interested.
How to Improve the Exit Pages Metric
To reduce exit rates, optimize your content to encourage more page views and improve page layout and navigation. Also, check that you meet all expectations and provide clear calls to action and links to other helpful, related content.
It can help to plan your website pages and content like a flowchart. This process can help you identify the best entrance and exit points on your website from a marketing perspective and what pages visitors need to hit along the way.
Metric #6: Leads and Sales
Leads and sales represent the number of potential customer inquiries or purchases generated by your B2B website. This metric is vital, directly influencing your online revenue growth. Only you can decide on a decent benchmark based on your industry, target market, and non-website-driven leads and sales. Comparing current performance to previous periods will give you insight into sales and marketing performance and opportunities to help you create winning marketing strategies.
How to Improve Your Leads and Sales Metric
Improve sales by making all call-to-actions visible, using personalized content, and setting up easy-to-use web forms. Consider offering high-value incentives like eBooks or webinars to boost lead capture. Email marketing can also be effective for nurturing leads and simplifying the buyer’s journey for some prospects.
Metric #7: Page Load Speed
Page load speed is how long it takes for your web pages to load and display content fully. A fast load speed enhances user experience and reduces bounce rates, improving SEO rankings. Aim for a benchmark that is three seconds or less. Comparing current values to past periods is a reliable way to recognize improvements and measure user satisfaction.
How to Improve the Page Load Speed Metric
Compress resources, minimize code, and consider content delivery networks (CDNs) for faster loading across regions. It’s worth regularly monitoring performance and testing improvements to ensure quick page rendering remains constant.
These website improvements fall squarely into the realm of technical SEO. Consider partnering with a marketing agency who can work with you and your web development team to identify and improve the technical aspects of your website that may be holding you back.
Metric #8: Search Keywords

Search keywords represent a core of specific related terms and queries users type into a search engine like Google to find your website. For B2B businesses, this SEO metric is critical as it indicates content aligned with user intent. As for benchmarks, your goal should always be to strive for top-of-page search rankings related to your business and prospects, and improved click-through rates. Comparing current data with historical records lets you see the efficacy of your SEO efforts.
Even in the world of B2B digital marketing, your audience may not know or care about the proper industry terms and jargon. For example, the metal recycling industry thinks it has an image problem, that the term “scrap metal” has a lot of negative connotations. They would prefer to use a term like “metal recyclables.” Very reasonable, the only issue is that 99.99% of online users are still going to search for related information using the term “scrap metal.” Don’t be afraid to follow the data.
How to Improve the Search Keywords Metric
Use relevant, often layman-level keywords in optimized content that reflect user intent to improve search rankings. Make a habit of keeping up with changing trends and use more long-tail keywords for niche targeting and better SEO rankings.
Lastly, incorporate schema markup into your strategy. Schema markup is structured code businesses add to their sites to help search engines better understand the type of content on their website. This can improve Google and other search engine rankings for your website, increase CTR, and provide a better user experience.
Metric #9: Social Engagement
Social engagement measures how your target audience interacts with your content on social media and the perception of your business at large. This metric reflects brand visibility, audience interest, and community building. Comparing current engagement to earlier interactions lets you see how your campaigns are improving. Data comparison also gives you a better picture of audience preferences.
The benchmarks for social engagement metrics vary between businesses and industries. You will want to consider at least some or all commonly tracked metrics below:
- Likes/favorites
- Shares and retweets
- Comments and replies
- CTR
- Engagement rate
- Follower growth rate
How to Improve the Social Engagement Metric
The secret behind effective social engagement is simple. You create shareable, highly relevant, visually appealing content that resonates with your target audience. Use strategic hashtags and encourage audience participation through engagement request content like polls or questions. You must also be present and engage with comments and direct messages (DMs). Collaborating with influencers and running contests can also significantly increase brand engagement and build interactions.
Website Metric #10: Traffic
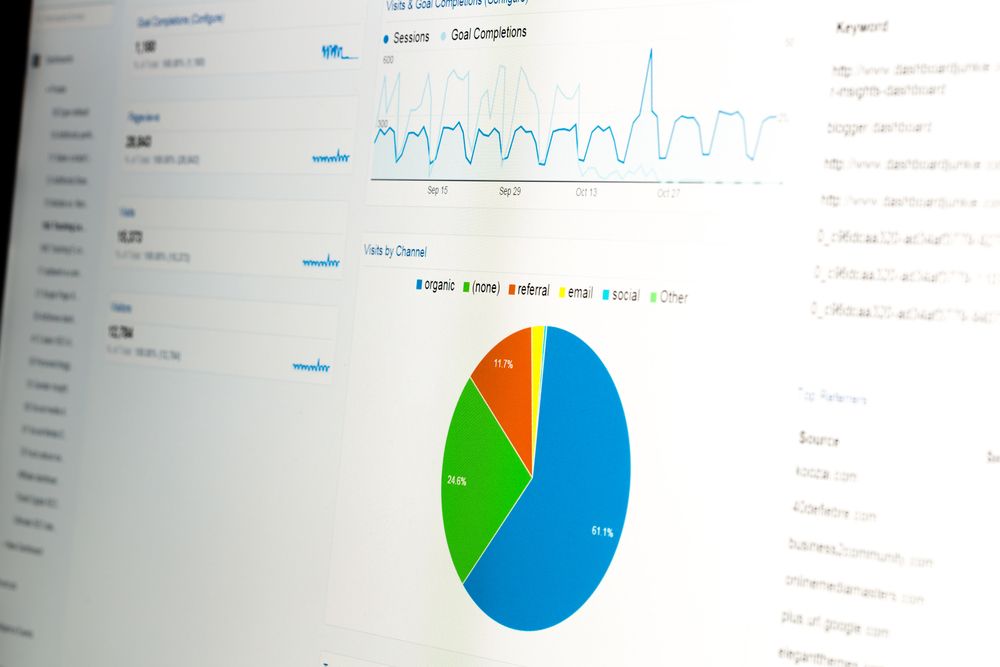
Total traffic volume measures the overall number of visitors to your website, and traffic sources tell you where they come from. Traffic volume includes the number of unique visitors and returning visitors. This metric reveals brand visibility and marketing effectiveness. You will need to set benchmarks based on your company’s size, age, industry standards, and anticipated goals. You can analyze traffic data by mobile, organic, referral, paid, social, and total traffic categories. You can also look at devices, locations, and time of day your visitors arrive at your B2B website. Comparing current to past traffic values (monthly, annually) helps track growth and campaign effectiveness. This information is critical to planning your marketing strategy and what ways work best to reach your audience.
How to Increase the Traffic Metric
Boost your traffic by diversifying marketing efforts across selected channels. Optimize your web pages for search engines, leverage social media, and run targeted ad campaigns. Other proven methods for attracting and retaining visitors include high-quality, relevant content, regular website updates, and audience-focused strategies.
Stay Relevant: Get New Traffic with Bold Entity’s Digital Marketing
Bold Entity is an established B2B digital marketing agency in Dallas, offering full marketing services to middle-market companies like yours. These comprehensive services include SEO, PPC, and SMM. Our talented team produces high-quality content relevant to your target audience. The content is distributed through the most effective channels at optimal times as we track your results.
Discover the Power of Bold Entity’s Digital Marketing Services
Conclusion
Website metrics are essential for B2B companies to track and analyze critical information. This valuable data allows you to gauge the effectiveness of your online presence and make improvements as necessary. Monitoring the 10 vital web metrics discussed in this blog will help you make the right business decisions to achieve your goals. Those decisions might include updating in-house digital marketing strategies or collaborating with an expert agency.


